
Monitoring
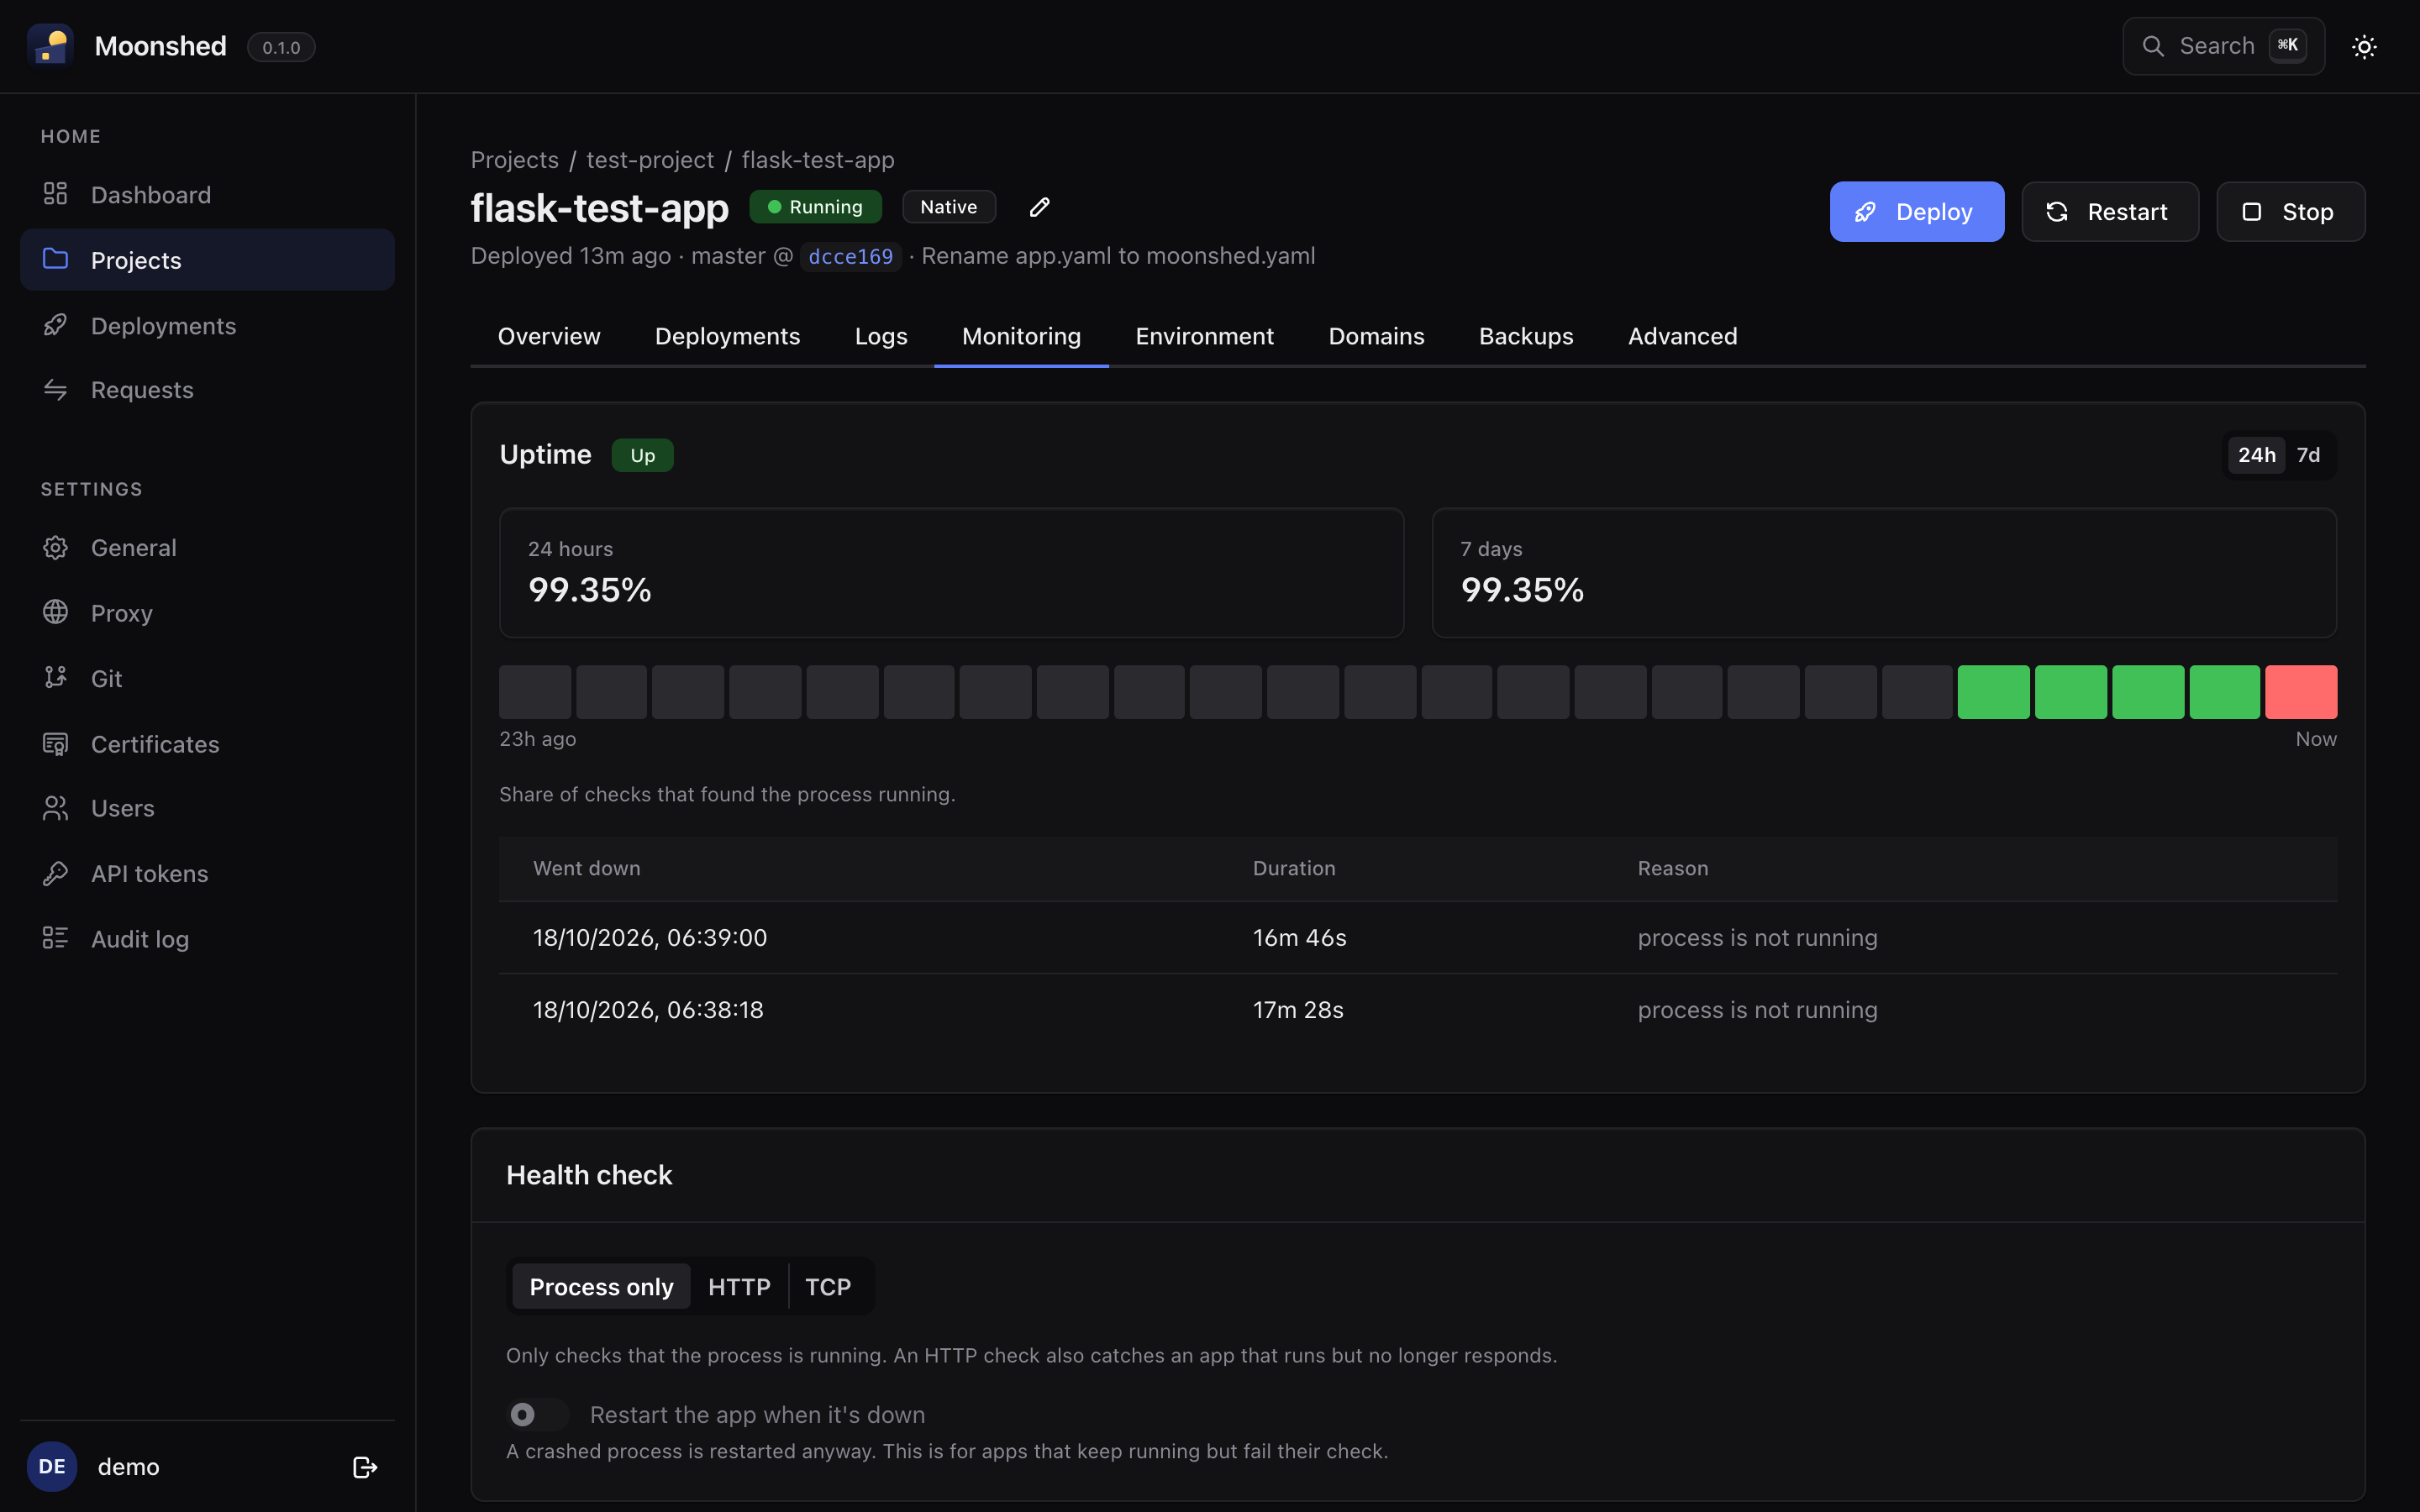
Health checks
An app's health check decides when a deploy has succeeded and whether the app counts as up. Set it in moonshed.yaml or on the app's Monitoring tab:
health:
  http: /healthz     # or: tcp: true
  interval: 30s
  timeout: 5s
  failures: 3
  grace: 10s
restart_unhealthy: truehttprequests the path on the app's port and passes on any status below 400.tcp: trueonly checks that the port accepts connections.- No health check means Moonshed only checks that the process is running.
| Setting | In the UI | Default |
|---|---|---|
interval | Check every | 30s |
timeout | Timeout | 5s |
failures | Down after | 3 failed checks in a row (1 for the process check) |
grace | Wait after start | 10s |
Health settings apply from the next check. They don't need a deploy.
Auto-restart
With restart_unhealthy: true (Restart the app when it's down), Moonshed restarts an app that is running but failing its health check. A process that crashes is restarted either way.
Uptime and incidents
Each check is counted in the app's row for that hour: how many passed out of how many ran. Uptime is passed checks divided by all checks, shown for 24 hours and 7 days.
Hours with no checks, because the app wasn't deployed, was stopped or Moonshed was offline, show as No data. They are never counted as up.
When failures checks fail in a row, an incident opens. The next passing check closes it.
Metrics
Moonshed samples metrics every 5 seconds:
- Server: CPU, memory, disk, network in and out, load.
- Each app: CPU, memory and process count, while it's running.
- Each domain: requests per second, 4xx and 5xx per second, and average response time.
Samples are rolled up in memory and only the rollups are stored, so storage stays fixed at about 2,000 rows per app or server:
| Resolution | Kept for | Chart ranges |
|---|---|---|
| 5 seconds | 15 minutes | 1m, 5m, 15m |
| 1 minute | 12 hours | 30m, 1h, 6h, 12h |
| 5 minutes | 48 hours | 24h, 48h |
| 30 minutes | 7 days | 7d |
Charts draw the average for each point, with the peak as a dashed line.
Request log
The Requests page records requests that go through the proxy. Pick the apps to record and start; you can add or remove apps while it runs.
Each request stores the time, method, host, path, query, status, duration, size, client IP, user agent and referer. Bodies are never stored.
- Each app keeps up to 100,000 requests. Older ones are dropped.
- Stopping the recording deletes everything recorded, and removing an app deletes its requests.